I lived a different season this year at Tel Azekah. Usually it’s the joys and pressures of supervising an area — leading an assorted group of enthusiastic diggers (some students of archaeology, others volunteers from other fields), while dealing with the correct archaeological documentation. This year, due to Covid-19, the expedition was far smaller, and my own area N1 was not open, so I only joined for a couple of weeks, to help out on site for some hours, but mostly to work on the documentation of the past seasons.
To quote a good friend and colleague: “On site, we dig … but in the office we excavate”. He’s right in more ways than one. Digging part is only the proverbial tip of the iceberg, there’s plenty of finds processing. But perhaps the most hidden to the uninitiated is the challenge of making stratigraphic sense of it all, which gets complicated on a Tel. Looking back at the documentation, with the hindsight of a few seasons of experience was rather fruitful: it’s the reality of any research, looking back at previous work with the sense of “if I knew then what I know now.”
Size adds to the complexity. My own area is vast, covering some 28 five-by-five metre squares (that’s effectively c. 560m2, with several baulks still in place), dug over five seasons, and going from Middle Bronze Age, right through to Roman, depending on where you put in your shovel. The ancient peoples were quite unhelpful in not bothering to separate their strata (or even label their finds before throwing them away), but rather built into the ruins of each other. They used and reused the same materials, and colours are different shades of beige, often depending on the light of day and the humidity. Thankfully, Wheeler and Kenyon alerted us to the usefulness of sections. But it is to Dr Harris, that we owe the now-standard tool to deal with stratigraphy (read more on the Harris Matrix here, external link).
I love the Harris Matrix, in a weird kind of way. It obliges me to make logical sense of the stratigraphy. On a vast site, with plenty of pottery, it can be tempting to read the stratigraphy in terms of the pottery first, which can however, short-circuit the process. The Harris Matrix obliges the archaeologist to stay within logical boundaries. Should be common sense, but in the heat and dust, it is less than common …
| A later than B | A equal to C | B is earlier than A |
|---|---|---|
| A above B | B below A | |
| A cuts/intersects B | B intersected/ cut by A | |
| A abuts B | A adjoins C | B abutted by A |
| A fills B | B filled by A |
Sound simple, but adhering to it obliges the archaeologist to return to the field, or the notes, when some elements do not make sequential sense, to figure out why. Perhaps, an animal burrow — I positively remember finding plastic, “sealed” underneath an intact tabun. May be pits: they aren’t always easy to distinguish, except in section, and in hindsight. But no, your wall cannot be Iron Age, if you have Roman pottery stratigraphically below it … and if you have a good reason to still hold onto the Iron Age wall, then you need to explain properly your later pottery. Stuff does for fall off the baulk, a stray sherd may find itself in the wrong basket, or a less experienced digger may get thing mixed. Whatever the answer, you still need one that fits.
As long as an area or square is small, the Harris Matrix can be relatively simple, and easy to draw by hand. I have quite a few examples scribbled away over the seasons. As thing get more complicated — especially spanning over several seasons, I felt the need to move to doing it on computer. But it is not easy to find the right software, at least for what I had in mind.
A few years back, I had used Stratify (external link). I had found it relatively easy to use, and free — which is always a plus. But once the matrix gets very complicated, there is no way of taking control of how the matrix is presented, and it ended up — in my view — rather unaesthetic, with interconnecting lines all over the places. Moreover, the software has not been updated in 10 years, now, and the code remains closed, so no one else can pick up the tab to update and improve it. I’ve also had issues in trying to use it on Windows 10. All in all, I felt the need to look for something else.
There are, of course, some commercial options. Not terribly expensive, but not exactly cheap, either, if yours (like mine) is a very occasional use. I also looked into the resulting matrices, and — while surely correct stratigraphically — still doesn’t seem to respond to what I was hoping for.
I tried to look for free software or something open-source designed for Harris matrices, but could find none. But, of course, the same logic behind a Harris Matrix applies elsewhere too. Apparently, in Graph Theory, the Harris Matrix is a Directed Acyclic Graph or DAG (read more here [external link] , under Graph Drawing > Theory). There’s even free online tools to build such graphs such as DAGitty [external link]. It is distributed under the GNU general public licence, so perhaps someone more code-minded than myself — hint! hint! — may even create a version more tailored to archaeology! The downside, at the moment, is that it is currently browser based, and there is no ready-to-download-and-install version.
I eventually settled on something else. Say hello so diagrams.net [external linkl, formerly draw.io! It ticked many of the right boxes: firstly, it is free and open-source; secondly, it offers the option to work online or download to you PC; thirdly, I can export my matrix as an SVG, JPEG or PDFs, handy to include in reports; finally, and more importantly, it is very intuitive and easy to use. Very much a point and click, to create shapes and join them, with great ease to move shapes around, and the arrows following you once you connect the points right.
It is a diagramming software (great for flowcharts), rather than something more specific. The downside, therefore, is that it does not check for cycles (the A of DAG), as Stratify or even DAGitty will do. The plus side, is that it gave me the flexibility is was looking for. I’m also sure this nifty bit of software has plenty of other applications for anyone needing to work with flowcharts and diagrams of various kinds.
Here is one of the simpler examples I produced:
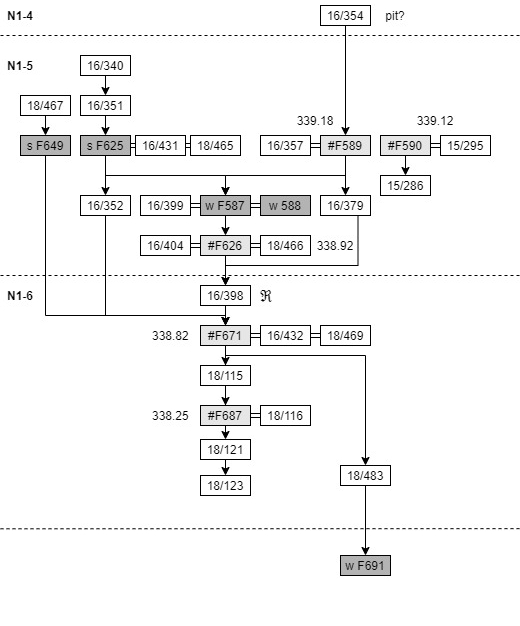
In case you’re wondering, there’s plenty of options for shapes and colours. I opt for greys for greater clarity in printing. I also keep it simple as I find it easier to read. But then, others may have a different aesthetic.
So, what software, if any, do you use for your Harris Matrix?

Looking back at the documentation, with the hindsight of a few seasons of experience was rather fruitful: it’s the reality of any research, looking back at previous work with the sense of “if I knew then what I know now.” This point of yours got me into a moment respite of fruitful reflection. Thanks alot!